OP-010 · Version 1.0.0
Business KPI Dashboard: Excel KPI scorecard
KPIs with monthly targets, traffic-light status, year to date, trend and a printable sheet per KPI, no macros.
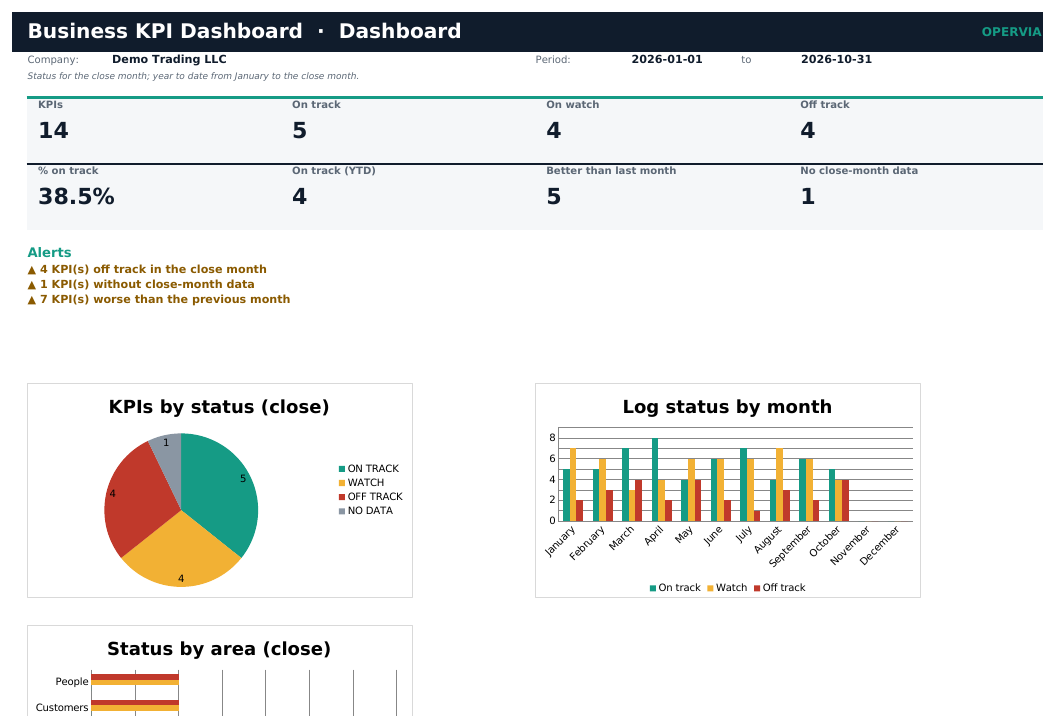
Business KPI Dashboard is an Excel workbook to track your company's key indicators month by month without paying for business intelligence software.
Define each KPI with its target and direction, log the month's actual value and the workbook calculates the traffic-light status, year to date and trend versus last month, and lists KPIs off track.
The trend sheet shows twelve months of any KPI with an actual vs target chart, ready to print for the monthly meeting.
Features
- ON TRACK, WATCH and OFF TRACK status with configurable tolerance.
- KPIs where higher or lower is better.
- Year to date by sum, average or close value.
- Monthly targets with per-month exceptions.
- Printable trend sheet with actual vs target chart.
- Reports by area, status and month with charts.
- Includes demo, PDF manual and quick start. No macros.
Who it is for
Managers and small business owners who want to review key indicators in a monthly meeting without paying for BI software.
What it does not include
It does not connect to other systems, handle weekly or daily KPIs or calculate KPIs from source data.
Editions
| FREE (demo) | PRO | |
|---|---|---|
| Workbook with sample data | ✓ | ✓ |
| Empty template for your business | — | ✓ |
| Capacity | 20 KPIs / 300 log rows | 60 KPIs / 3,000 log rows |
| PDF manual and quick start | — | ✓ |
| Minor updates within the same major version | — | ✓ |
What you get
- Business_KPI_Dashboard_Demo_EN.xlsx
- Business_KPI_Dashboard_EN.xlsx
- CHANGELOG.txt
- LICENSE.txt
- Quick_Start_EN.pdf
- README.txt
- User_Manual_EN.pdf
Requirements
Excel 2016 or later, Microsoft 365 or LibreOffice Calc 7.6+. Windows, macOS or Linux.
Questions about this product
Which KPIs does it include?
The demo includes 14 examples from sales, finance, operations, customers and people. In the template you define your own.
How many KPIs does it hold?
The PRO edition holds 60 KPIs and 3,000 monthly log rows. The demo holds 20 KPIs.
Does it handle KPIs where less is better?
Yes. Each KPI has its direction: expenses, complaints or turnover use lower is better.
Does it connect to my accounting system?
No. Values are typed or pasted each month.
Version history
1.0.0 · 2026-11-16
- First release: KPIs with direction and monthly target, monthly log, traffic-light status with tolerance, year to date, trend, printable sheet per KPI, dashboard and reports.